Everything you need to run a fleet — nothing you don't.
MAJIC pairs a friendly dashboard with serious plumbing underneath. Here's the whole toolbox, plus a real look at the screens your subscription unlocks.
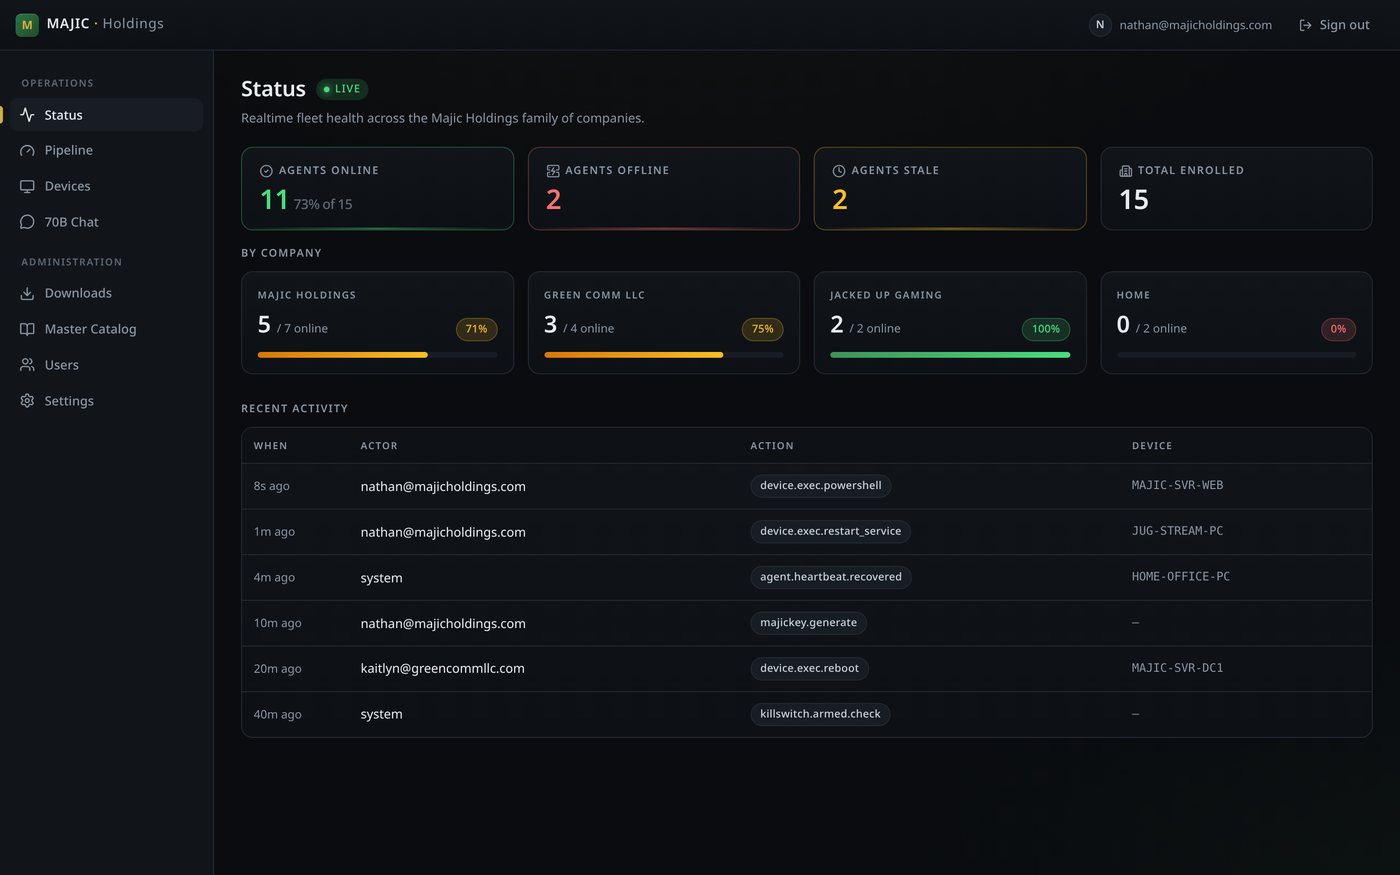
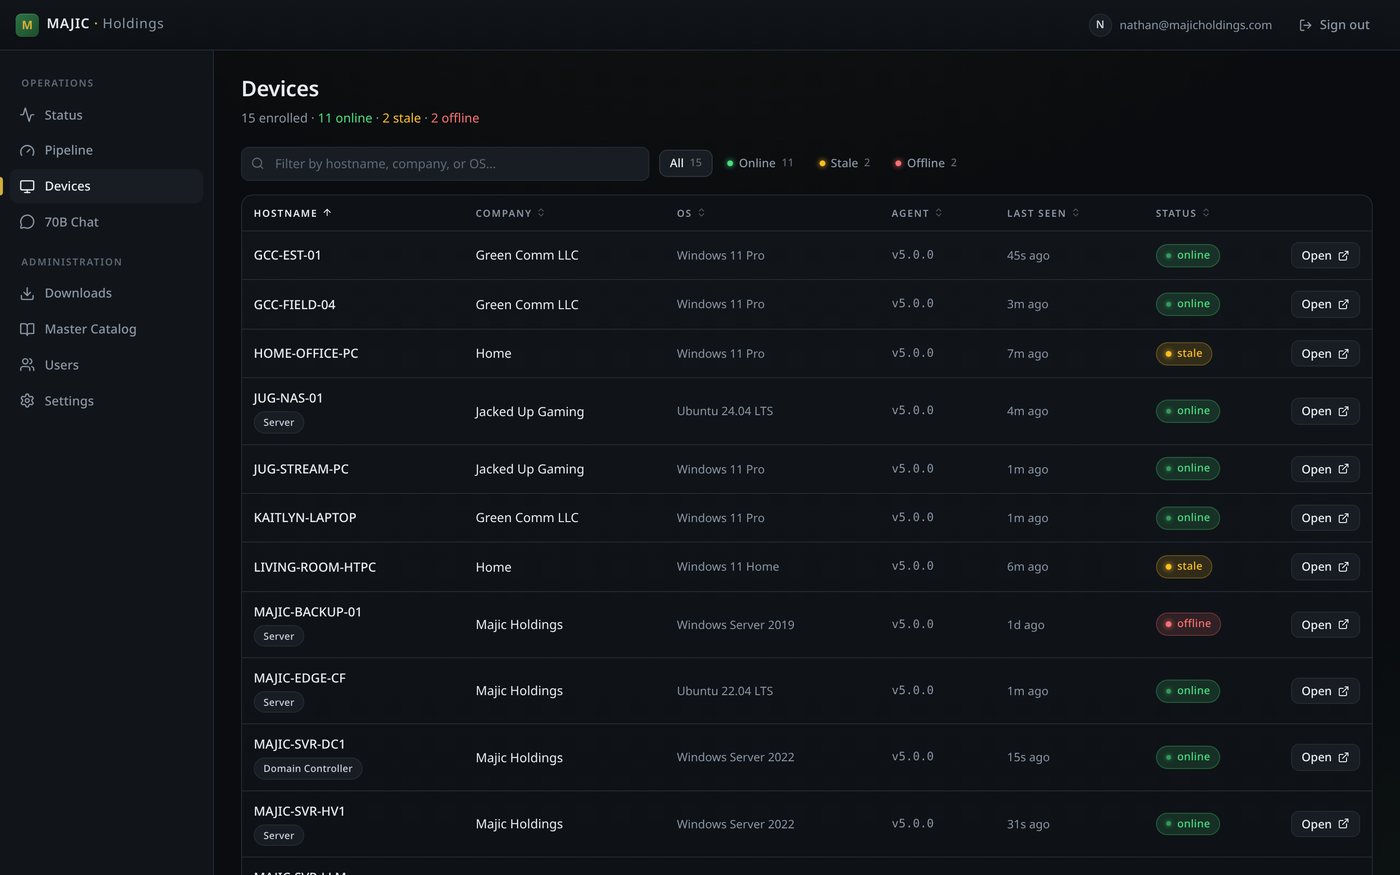
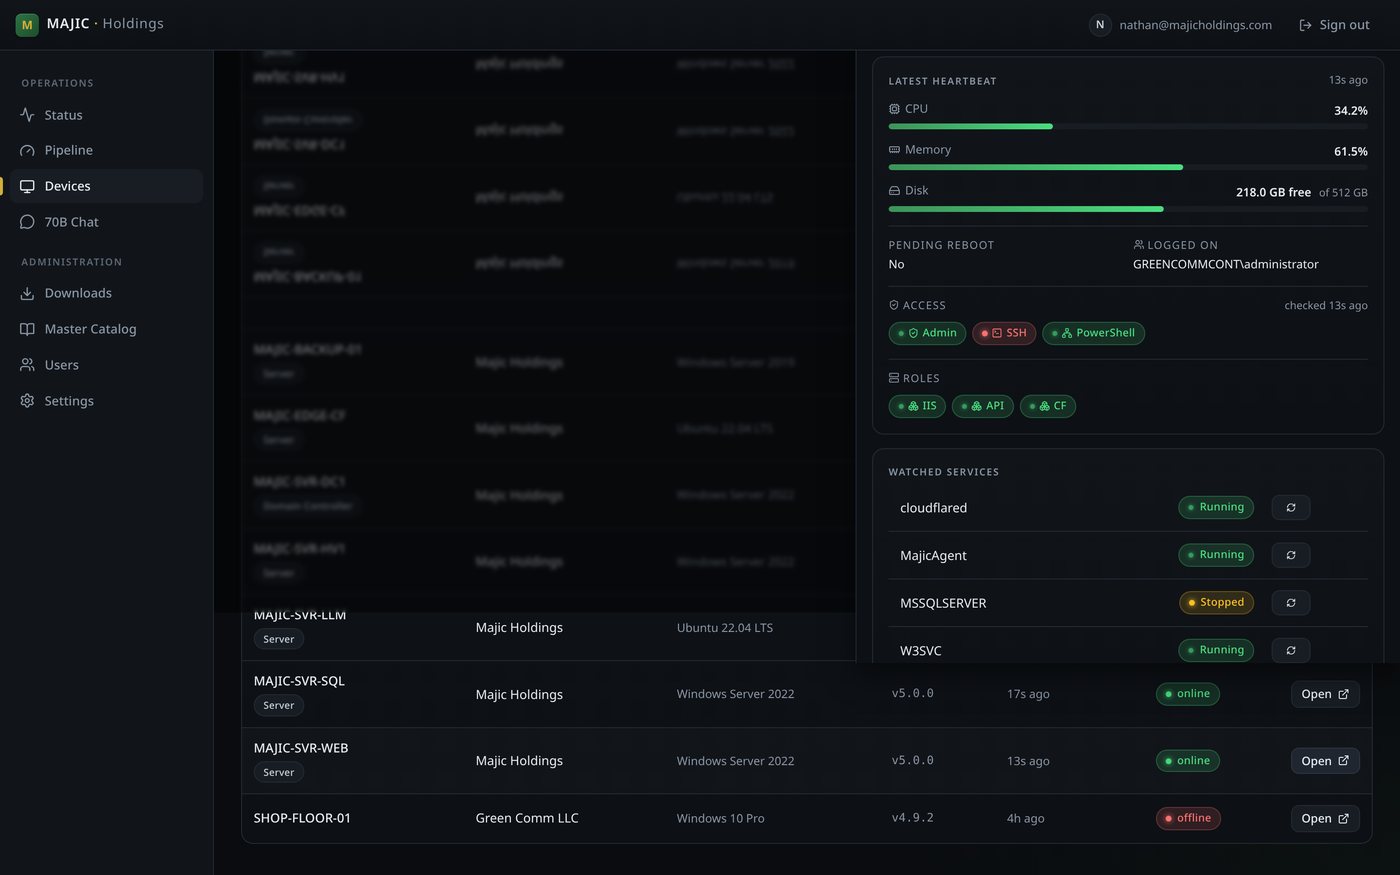
Live fleet monitoring
CPU, RAM, disk free/total, uptime, heartbeat, pending-reboot flags, logged-on users and watched services — refreshed continuously over a live channel.
Role-detecting agent
One installer auto-configures by role: IIS, SQL Server, LLM/Ollama, AD & DNS, file shares. The right checks turn on by themselves.
Remote management
PowerShell & SSH execution, reboot, and restart-service — dispatched securely over SignalR. Plus TightVNC remote-to-host through a Cloudflare Access tunnel.
Zero-inbound security
Outbound-only Cloudflare tunnels mean no open ports and no firewall holes. Role-based access and step-up MFA gate the dangerous buttons.
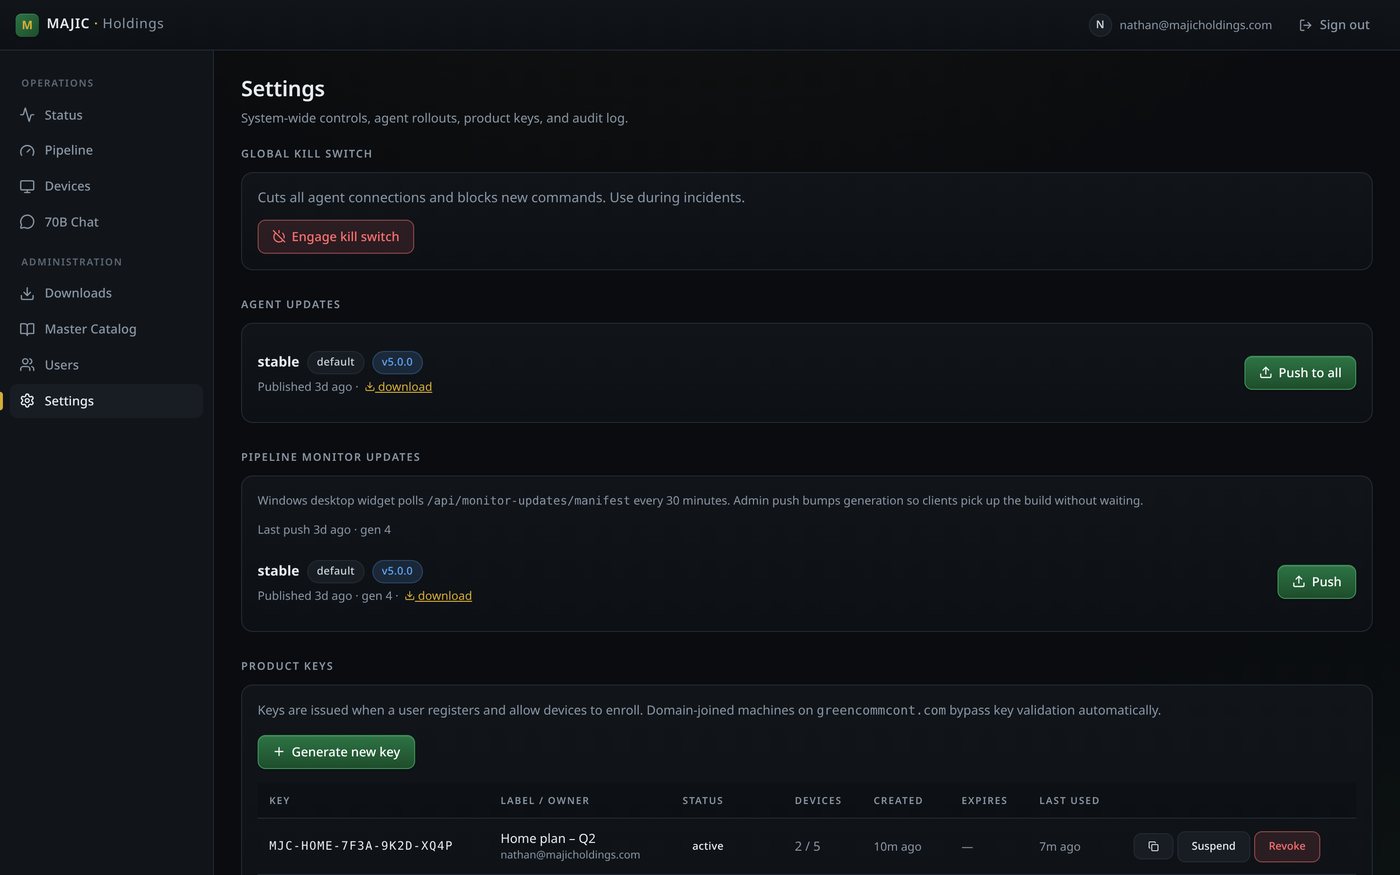
Self-healing agents
Agents recover themselves automatically and log exactly why. Combined with a global kill switch for instant fleet-wide lockdown.
Product keys & access
Generate, suspend, revoke and expire enrollment keys. Set per-key device limits. Role-based access for your whole team.
Audit everything
Every action — command, reboot, key change, sign-in — is recorded with actor, device and timestamp, and is fully searchable.
AI integrations
A private, GPU-hosted LLM stack plus Claude / MCP connectors so you can query the fleet in plain English with scoped, revocable tokens.
One-click roll-outs
Push the newest agent or desktop-monitor build to the entire fleet from a single button, with version channels.
See your dashboard
This is exactly what subscribers get.
Real screens from the MAJIC admin dashboard — the same one that runs the Majic Holdings family of companies every day.

Ready to see it on your own machines?
Pick a plan, or start free. You'll be looking at live data in minutes.